The United Kingdoms National Debt is the total amount of money borrowed by the government at any one time. Political parties often pledge to reduce this figure and it is generally accepted that less debt is a good thing to have. Have you ever wondered though whether any parties actually achieve their goals in reduction?
We’ve taken the last 300 years of national debt figures and visualised them in order to see exactly how past governments have gotten on with tackling the issue. The following provides a breakdown of exactly how much the UK was in debt year by year and who was in charge at the time.
A NOTE ON RANGES
Before we get into looking at the figures, its important to point out a big problem when comparing this kind of data spread out over such a long time period. Due to the huge range of numbers from the starting debt of 300 years ago up to todays figures, its impossible to chart them on a scale that meets any kind of humanly understandable perception. The first 200 years or so could just about be managed but when we get into modern times the level of spending rockets up so dramatically that it becomes hard to find data visualisation software that can handle the scaling. So it was decided to break the visuals into 30-year chunks and reset the scale each time. This is generally considered bad practice, but in order to present the whole of the data in one go, this was really the only option. So when comparing figures from one chart to the next, be aware that the last year represented in one chart, becomes the first year represented in the following chart.
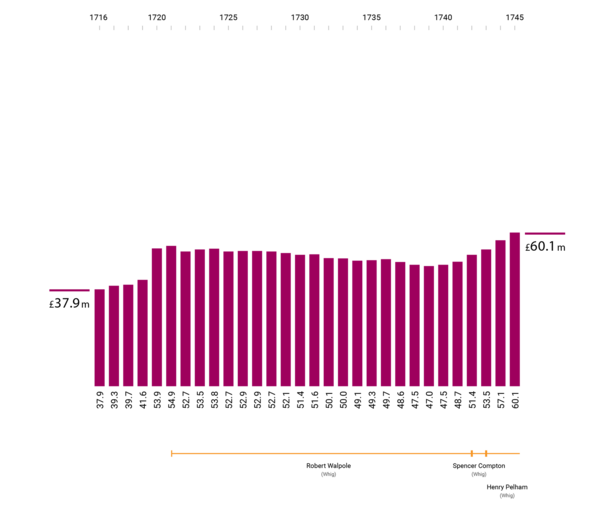
1716 - 1745
So we start off in 1716 back when the Whigs (a political faction who became a party with origins in constitutional monarchism) were the dominant political party in the UK. In 1716 the total amount of UK debt was just £37.9 million. It rose slightly before Robert Walpole came into power who then managed to keep spending pretty much on a level throughout his lengthy term.
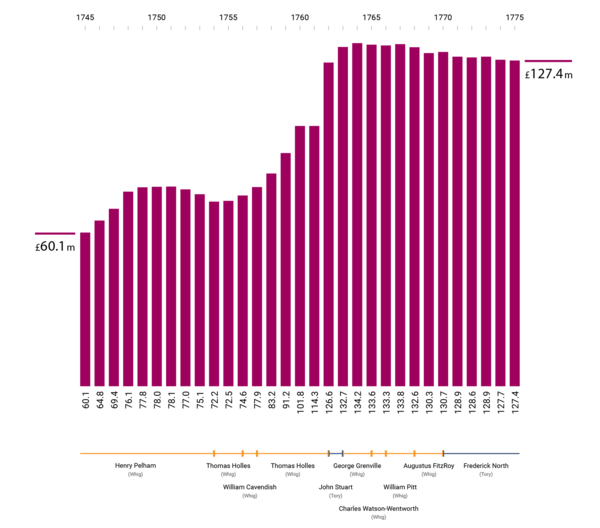
1745 - 1775
Spending started to climb around 1745 which was around the time of the last main Jacobite rebellion (The Battle of Culloden occurred in March 1746). After 1760, industrial and economic growth started to rise which allowed Britain to lead the way (worldwide) in industrialising the nation. The building of factories and canals plus agricultural productivity all expanded dramatically throughout this time. In 1756 Britain embarked on the 7 years war against France (and later Spain). Borrowing during this time increased considerably (nearly doubling).
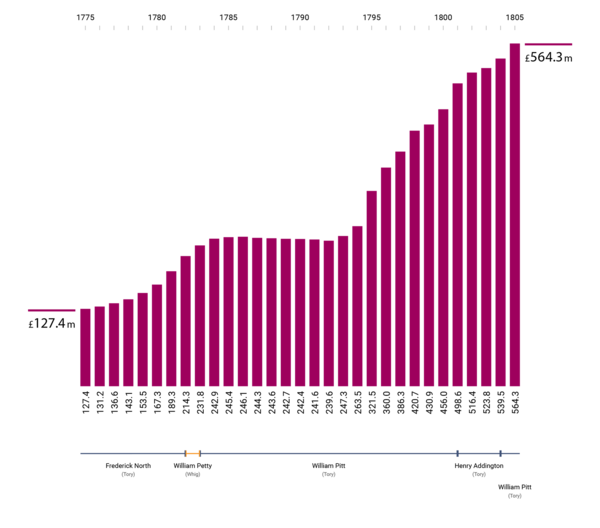
1775 - 1805
The Tory party (different to modern day Conservatives) held power throughout most of this period. In 1775 the American War of Independence started which lasted the next 8 years. Ireland was granted legislative independence in 1782 although Irish parliament was dissolved when the Act of the Union created the United Kingdom of Great Britain and Ireland in 1801. Britain saw a huge population growth (7.1 to 14.2 million people) in the 100 years after 1720, most of which happened after the 1780s at which point national debt stabilised for nearly a decade up until the Napoleonic Wars started spanning 1793 - 1801 and 1802 - 1815. It is considered that the ability to finance war extensively after 1793 allowed Britain to build an empire within 20 years that would dominate the world stage to a point no other European country had ever managed.
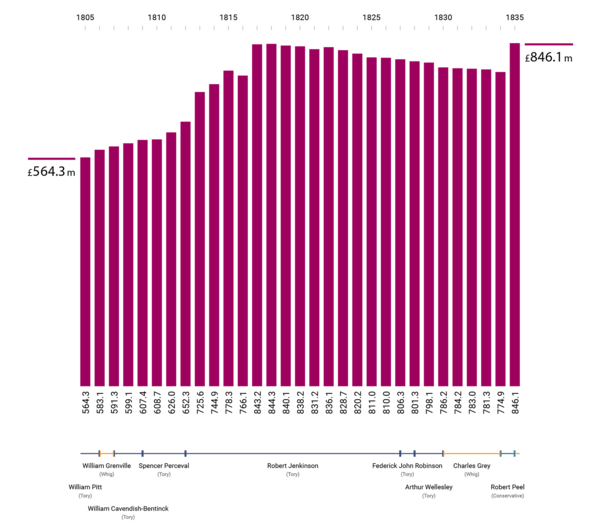
1805 - 1835
A widespread Smallpox inoculation helped to bring down mortality rates in the early 1800s. Lord Nelson won the battle of Trafalgar in 1805 and its largely accepted that Britain ruled the seas from this point on for at least the next 100 years. It should be noted that Robert Jenkinson (Tory) did manage to bring spending increases under control after a few years in power and even started to bring it down (nowhere near in relation to the amount it had risen though).
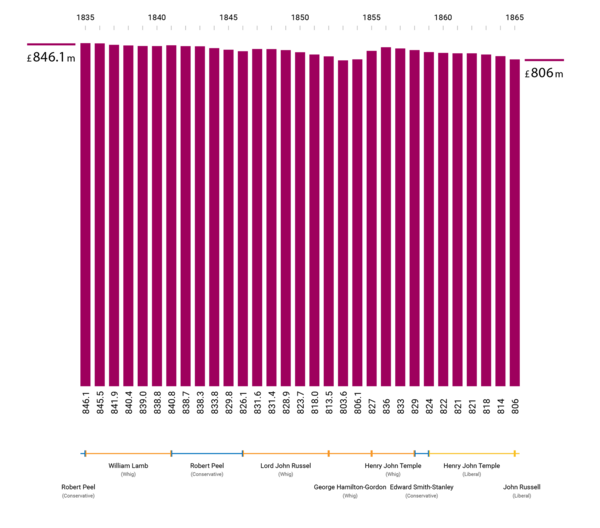
1835 - 1865
Queen Victoria took up her monarchy in 1837. The industrial revolution of this time brought great development but also huge challenges for many people. 1 in 5 children born between 1830 and 1850 were dead by the age of 5. Tuberculosis killed more than 60,000 each decade and Ireland was hit hard by famine in the 1840s which claimed the lives of more than 1 million people. Despite the hard times, debt remained pretty constant, fluctuating between 806 and 846 million.
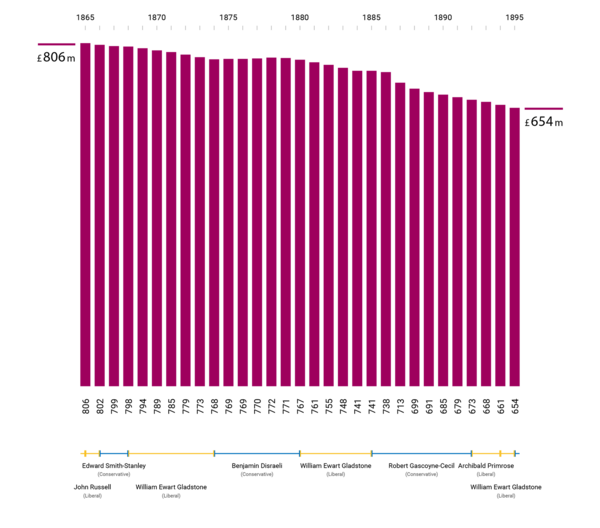
1865 - 1895
Towards the end of this period, Britain was at the height of its dominance over the world with about one-fifth of the planets surface being seen as part of the British Empire. It was also the financial capital of the world which secured huge investment and prosperity. Its not surprising that even though power changed hands regularly throughout this time, the Liberal and Conservative governments that ruled managed a slow but steady decrease in national debt - the only time in the last 300 years any significant reduction has been seen.
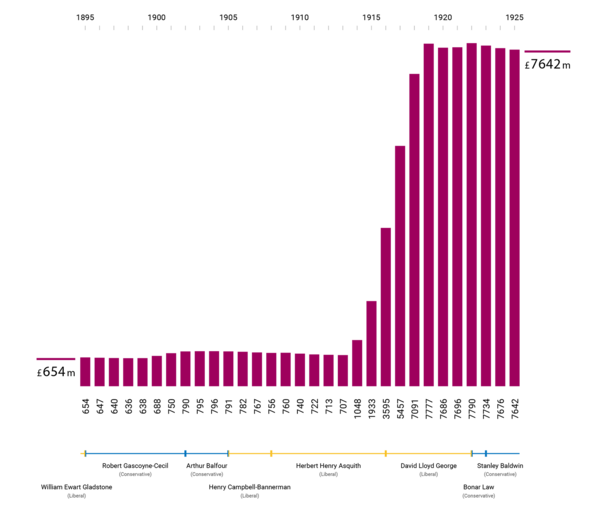
1895 - 1925
This period in time was dominated by the greatest war the world has ever seen. World War 1 lasted from 1914 - 1918. After remaining a relative constant for several decades, borrowing shot up nearly 10 fold by the time the war was over. It never came back down again.
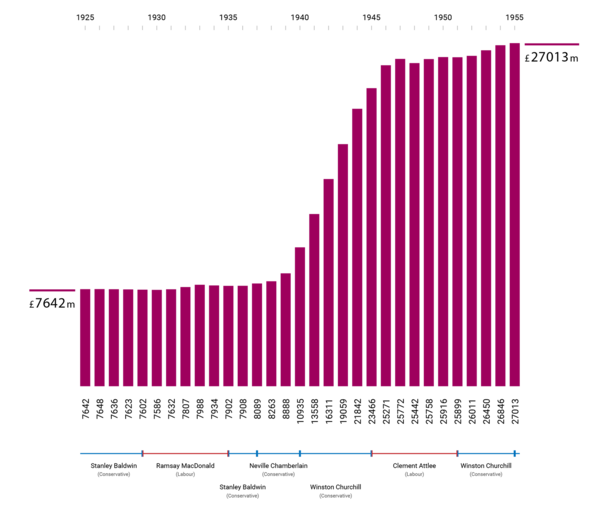
1925 - 1955
This next period was dominated by the Second World War which started for Britain in September 1939. The nations labour force was mobilised with men conscripted in 1939 and women from 1941. The war lasted until 1945 during which national debt would triple to £23.4 billion
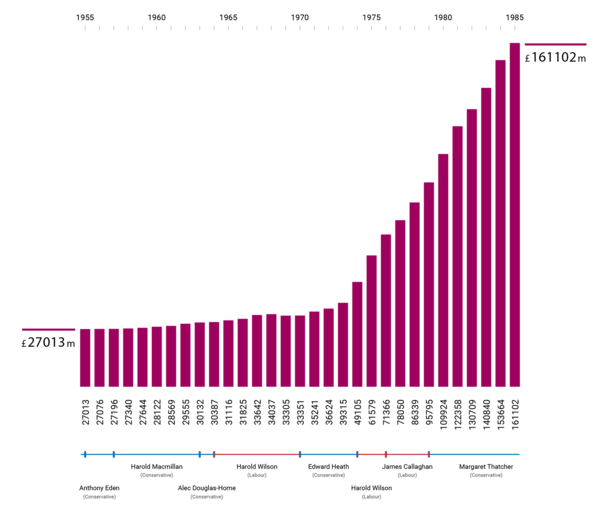
1955 - 1985
In 1945, Britain still had the biggest empire in the world, however this started to break up with much of it being granted independence by the 1960s. Much of this period was influenced by bolstering defences against the potential threat from the Soviet Union and ensuing Cold War. Troops were deployed in Northern Ireland in the 1970s as a response to escalating sectarian violence. In 1973 Britain entered the EEC which later became the European Union. Major parts of the economy were nationalised by Labour governments before 1979 only to be denationalised by Conservative governments in later years. In 1982 war with Argentina saw Britain successfully hold onto the Falklands. From the early 1970s, both Labour and Conservative governments increased national debt hugely with year on year increases topping £161 billion.
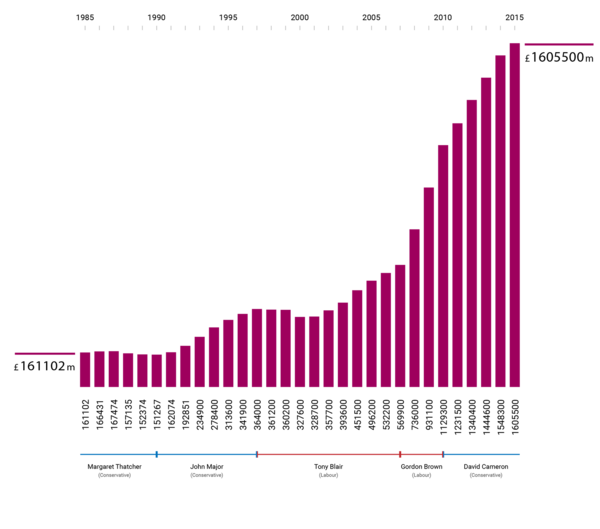
1985 - 2015
The most shocking rises in national debt belong to recent times though. In the last 30 years, the amount we owe as a nation has increased another 10 times from £161 billion to £1.6 trillion (at budget time in March 2017 this figure has risen to an estimated £1.73 trillion). This 10 fold rise is akin to that seen during the First World War but the starting figures dwarf that of 1914.
Whilst there are many factors that influence borrowing and spending, looking at these historical figures its hard not to see the correlation with increased debt during and after times of war. It would seem justified that borrowing may increase to pay for a conflict. Its less easy to understand why that borrowing doesn’t come down again afterwards though…
The only time Britain has even managed a small decrease in its national debt is during the period when the British Empire was at its height. As a nation, we were hugely wealthy at this point and the dominant player on the world stage. Yet we hardly made a dent in our national debt figures.
So to any politicians promising to tackle the spiralling national debt figures I say… Really?

Richard is a designer, whiskey drinker, music lover and Creative Director. After an early career in publishing saw him oversee the production of a range of global titles he turned his eye to digital, managing several design teams in UK agencies before founding Gather with fellow director Paul.