At Gather we’re constantly looking at research into data visualisation to help in the development of our tools to aid analytics and reporting for the web.
There’s a great number of tools available now to help with the visualisation of information, some are good at showing information clearly and concisely, others not so much.
Whether you are using a tool with a set design for graphs and charts or you’re creating your own freehand, its really important to ensure your visuals adhere to some common standards. That way you know viewers are getting a full picture of the data and you’re not misleading them in any way.
Here are the three most important rules i can share when it comes to considering data visualisation for the best possible User Experience.
RULE 1: CHOOSE PROPER VISUALISATION
When looking at the data you want to visualise, it's really important to choose the correct graph or chart that will properly convey the message.
it's become fashionable recently to display data in different and interesting ways. designers love to create beautiful artwork with their visualisations. There is a place for that, however if the viewer is spending more time figuring out how to read the data than actually consuming it, you have to ask yourself - is that the best UX?
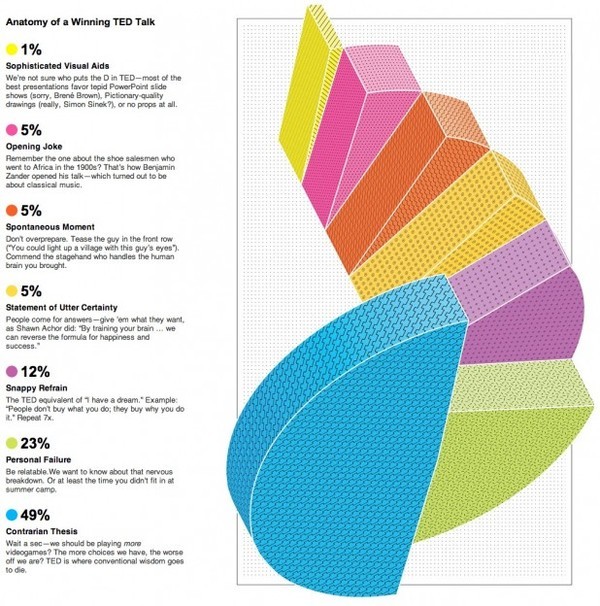
Take this example of an attempt to visualise the perfect anatomy of a TED talk. Its creator tried to do something funky with a pie chart, you can only assume to add a bit of interest. It leaves the viewer however, woefully lacking in any clear idea of the sections that are the most important. You have to look at the numbers themselves to understand that.
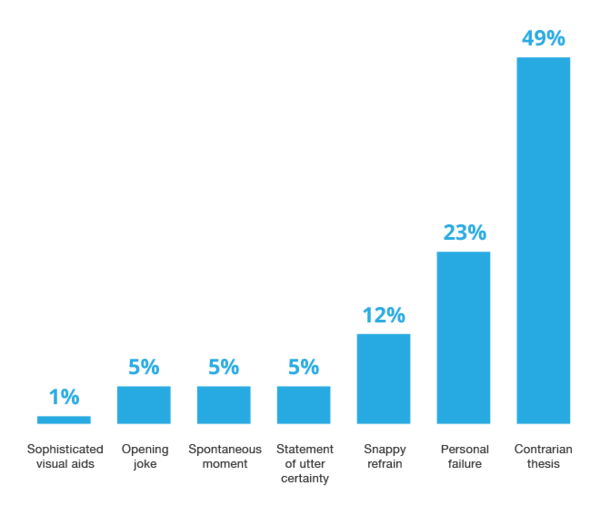
Putting the same data into a bar chart allows instant clarity as seen here.
There are a standard set of of graph types that have evolved over the last couple of hundred years suitable for most data sets, you should be considering these first.
RULE 2: AVOID CLUTTER
This rule relates to simplifying what's on the screen. We are in the age of the infographic (perhaps at its tail end), it's tempting to fill up the page with design aesthetics but really we should be asking what can we remove to make the point more clearly?
For instance, a bar chart with data points shown as numbers above each bar doesn't require a range to the side, thats just repeating the same information and not adding anything new.
Similarly, if the key message of your graph is summed up in the title, there's no need to produce a legend that saying the same thing. It's simply not needed.
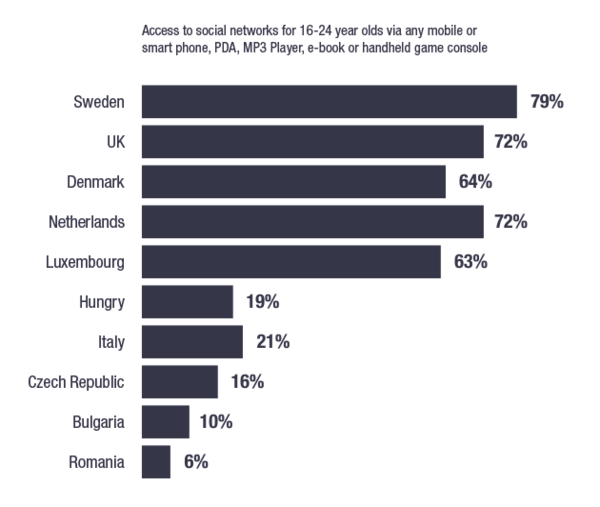
In the following example of a horizontal bar graph there are several elements that are repeating the same information found elsewhere such as the range and legend.
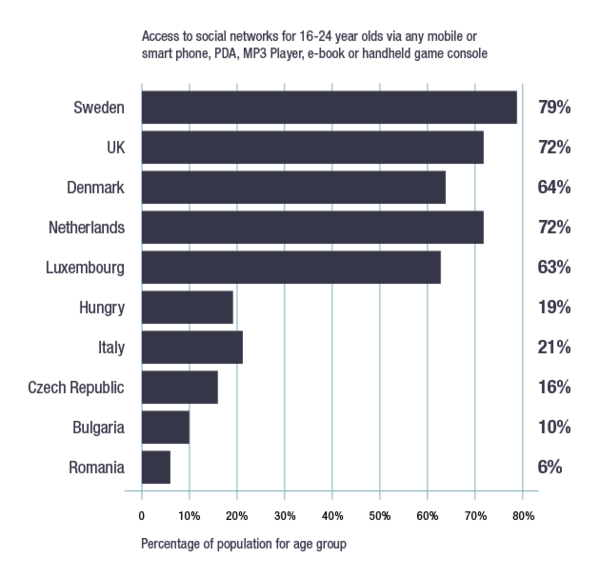
By removing these we offer a much cleaner visual and still provide the same information to the user.
RULE 3: USE APPROPRIATE RANGES AND VALUES
It's really easy to manipulate someone's perception of information, for instance by starting your base range not from 0 but further up the scale. Anyone engaged in spin and manipulating data for coercion purposes knows this and its a tactic often used to sway people towards a certain opinion.
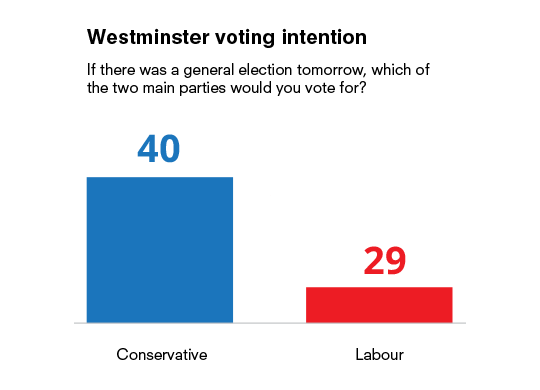
In this polling example showing the difference between votes for 2 political parties, the graph implies the conservatives are much more popular however the range has been brought up to around 25 which skews the visual perception dramatically.
Sadly, this type of misrepresentation is seen all too often. It's also surprising how many charts representing the whole of something use percentages that don't add up to 100.
These things aren't always done for malicious purposes, often designers believe by adjusting scales and ranges their making best use of the available space. The reality is though, they are nearly always skewing a users perspective of the data.
TO SUM UP
If you really want to provide accurate data in a way that makes it easy and quick for a user to understand:
- Choose the correct graph or chart.
- Avoid clutter.
- Use appropriate ranges and values.
For anyone interested in learning more about best practices for data visualisation, I'd recommend checking out the IBCS or International Business Communication Standards.

Richard is a designer, whiskey drinker, music lover and Creative Director. After an early career in publishing saw him oversee the production of a range of global titles he turned his eye to digital, managing several design teams in UK agencies before founding Gather with fellow director Paul.